Sitting around watching markets fluctuate can really try one’s patience. “Dow down 400 points,” reads one headline, followed by “Solid earnings drives the S+P higher” the next day. It’s an up and down roller coaster, and it’s sometimes hard to know which way you’re going.
Looking at our totals each month helps bring a little sanity to the madness. This paints the most accurate picture of our current situation, regardless of the noise around us.
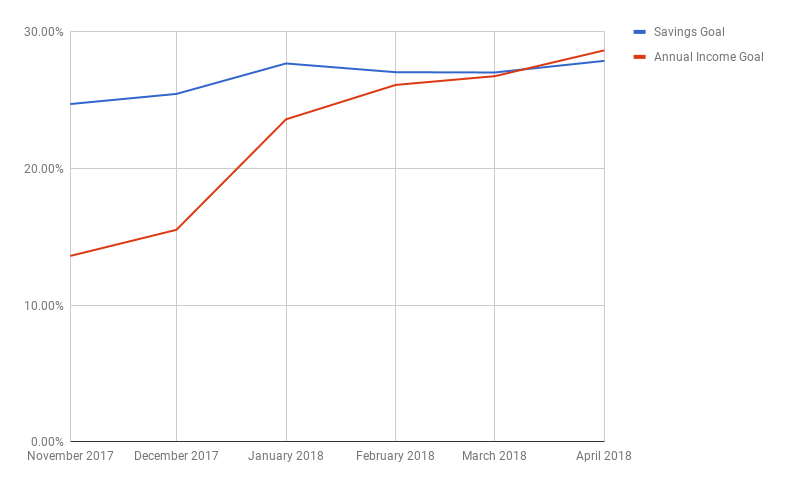
Here are updated account numbers as of April 30, 2018.
Formula = Savings x Yield = Annual Income
Savings: Total of all savings as a percentage of the total goal
Dividend Yield: Current yield of all tracked holdings (now including 401k’s!)
Annual Income: Expected dividends from all holdings as a percentage of the overall goal (now including 401k’s!)
On to the numbers!
Savings % = 27.88% (+0.83%)
Dividend Yield = 3.34%
Annual Income = 28.65% (+1.89%)
Recap
After two months of watching the total balance decline, it was nice to see it finally go back up. Mrs. Benjamins received an annual profit sharing bonus deposited into her 401(k), so that was nice! We continue to make regular contributions to both our retirement accounts along with monthly deposits into our regular after tax accounts.
An HSA balance was also introduced into the calculations, helping drive the balance increase (more on that soon).
Regardless of the account balances fluctuating, our projected annual income has increased every single month. Yep, every month.